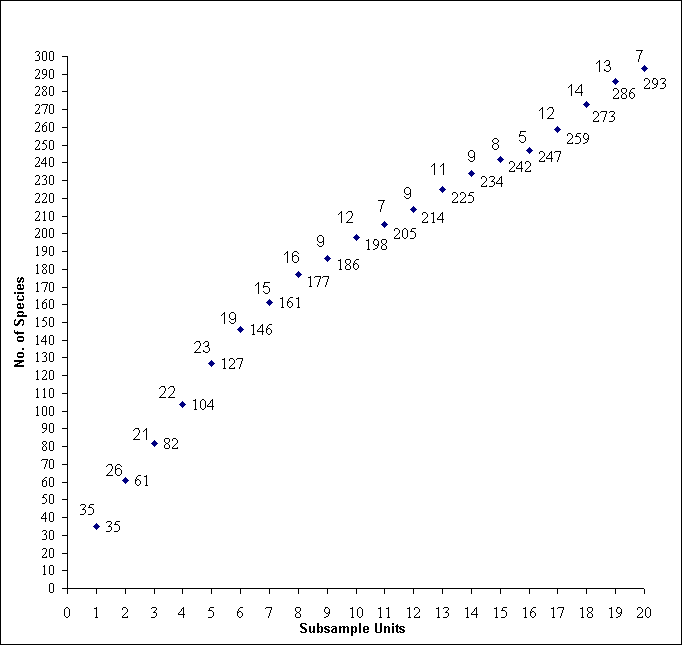
Fig. II-3. Species area curve for a sample of 800 trees. Each subsample includes 40 trees. The numbers below the curve equal total number of species and those above the curve equal the number of new species added with each new subsample.

Fig. II-3. Species area curve for a sample of 800 trees. Each subsample includes 40 trees. The numbers below the curve equal total number of species and those above the curve equal the number of new species added with each new subsample.
Back to The Forest